Showing posts with label low vision. Show all posts

Accessible charts and diagrams


Just as all images, charts and diagrams aren't the most accessible medium out there. But on the other hand, they're a very effective way of visualizing data - far more so than tables or written analyses.

Despite the abundance of various diagrams on the web, we rarely realize that they may present a significant accessibility challenge not only for blind Internet users. Choosing the wrong colors, scale or grid density can significantly reduce a charts readability for all users.

Although a chart will never be fully accessible to a screen reader user, you can still make it more or less accessible for all the other people out there.

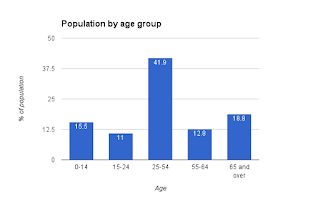
Let's start with some data. Here's the latest population distribution according to age for the European Union from the World Factbook:


Age group% of population
0-1415.5
15-2411
25-5441.9
55-6412.8
65 and over18.8
Total100


There are many ways to illustrate this dataset using different types of charts - we'll go through several of them and note their merits and drawbacks.

Basic circle diagrams


A circle diagram would probably be one of the most obvious choices to visualize percentages that add up to 100. If you don't tinker with your spreadsheet's default settings, you'll probably get something like this:

Basic circle diagram
(A)


Sometimes you also come across different variations of the same diagram:
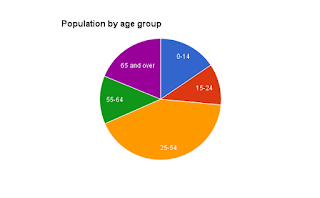
Circle diagram with category name labels
(B)
Circle diagram without sector borders
(C)

The slight differences between them make all the difference when it comes to accessibility - both online and in print.

Diagrams (A) and (C) use a color-coded legend to distinguish between the age categories. This is a very straight-forward solution, but it doesn't work well for color blind or partially sighted users.

A color blind viewer may not distinguish between certain colors. Unfortunately, it doesn't always have to be the well-known red-green pair. There are various forms of color blindness and choosing a set of colors to satisfy them all may prove impossible. You could of course try to use shades of gray to make sure all your colors have different contrast ratios, but this may not be effective when working with a long list of categories.

Using patterns or textures is another option, but looking at such diagrams can quickly lead to eye strain.

Additionally, low vision users may find it difficult to make out the color of a "sample" in the legend due to its relatively small size. Unfortunately, spreadsheets don't always let you change the size of the legend's color samples.

In the case of example (C) a lack of borders between the sections of the diagram additionally contributes to a color blind user's confusion as they may not even be able to work out where specific sectors end.

Diagram (B) partially resolves the color coding problem by placing appropriate labels inside the circle diagram. However, this in turn gives rise to another issue - the contrast ratio between the font and background colors. The font will most likely be black or white which means that if you have both a yellow and red sector in the diagram you're probably not maintaining enough contrast for one of them.

An extra issue with version (B) is the lack of clearly stated distribution values. Looking at the diagram alone it may be difficult to accurately estimate whether a given sector is 20% or 25% and almost impossible to tell apart some smaller values.

Labeled circle diagrams


Circle diagram with category name and value labels
(D)

A labeled circle diagram like the one in figure (D) is by far the most accessible of all the diagrams we've looked at so far. The labels are key here. They help the user easily make out which sector represents which age group and make it easy to associate a category with its value. The only potential issue you may have with this type of diagram is making sure the guidelines connecting a sector with the appropriate label are clearly visible and not confusing - e.g. make sure to have enough space between the lines.

Stack diagrams


Another way to visualize a trait's distribution is by using a stack diagram:
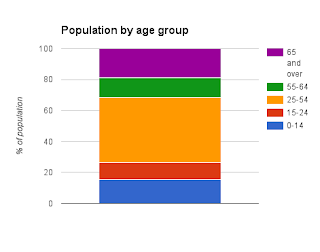
Stack diagram
(E)

Unfortunately, apart from the value markers on the left axis, this chart does not offer much more accessibility than the basic circle diagrams. If anything it is a little bit easier for color blind users to decipher which color corresponds to which label because the colors in the diagram appear exactly in the same order as in the legend (while circle diagrams with many small sections don't always make it easy to figure this out).

But on the other hand, a wide stack like the one above makes it more difficult to see the difference between categories with similar values.

Column diagrams


Another way to visualize data is by using column or bar diagrams. Here are a few examples:
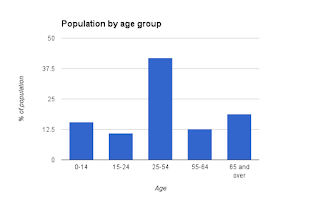
Basic column diagram
(F)

Column diagram with value labels
(G)

Column diagram with dense grids
(H)

These diagrams all have one major advantage compared to circle and stack diagrams: no color coding. Every column is labeled so it's easy to make out which represents which data category.

The greatest potential accessibility issue in these diagrams is reading column values. Users will usually do this by comparing a column's height to the scale on the vertical axis. So if you care about clarity, you should think twice about the scale you use. Unfortunately, spreadsheets don't always automatically choose the most human-readable scale to illustrate the data. Diagrams (F) and (G) automatically fitted the data into a 0-50% scale but divided the range into quarters producing 0, 12.5, 25, 37.5 and 50 as left axis labels. While technically there's nothing wrong with this, choosing 0, 10, 20, 30, 40, 50 markers would have been much more helpful and intuitive.

Adding extra grid lines as shown in (H) can also be helpful but here too you need to make sure the default settings make sense. Remember that there's no added value in setting secondary grid lines every unit when the main grid appears every 20 units. Too much "noise" behind the data columns will only distract the user.

One more good practice worth remembering is using column value labels like those in diagram (G). This solution is especially worth using when there's little variation between data columns' heights.

And a quick end note on other, non-standard diagrams: though often helpful, they shouldn't be used without good justification. After all, your goal in visualizing data is better and faster comprehension - the user shouldn't spend too much time on figuring out how the diagram works.

Accessibility by Example: Windows log in screen

OK, so you've read the theory on accessibility and are probably wondering what it all boils down to in practice. Well, that's what the "Accessibility by Example" posts are going to be about.

I'll be showing examples of accessible (or inaccessible) websites, software, hardware or just about anything else I can think of.

Let's start with a picture that'll probably seem familiar to most of us:

Windows 7 login screenshot

Microsoft's Windows operating system has been at the top of the pack for OS market share for years. You can pretty much assume that if somebody uses a computer they've probably seen a Windows log in screen at some point or another.

You see it, click on a user tile, type your password, hit enter and off you go.

But have you ever wondered what it's like for someone who can't see? Or maybe just has low vision? Or can't operate a mouse or keyboard all that accurately? Or - improbable as it may sound - sees it for the first time?

Color contrast


If you've read my previous post on basic accessibility for low vision users, you'll have probably already figured out that there's something seriously wrong with the color contrast.

Light blue paired with white make a popular and modern looking but unfortunately also quite inaccessible color theme.

The color contrast for the username text on this login screen is barely around 2.0 (actually it's between 1.9 and 2.5 as the blue is darker on one side and lighter on the other) - while the WCAG minimum is set at 4.5! The shading on the buttons doesn't help much either.

Blue and white can be combined to make a very accessible color theme, but you need to make sure you choose a blue dark enough to give you the desired contrast ratio.

Widget size


Button size (or, in general, clickable UI element size) is a major accessibility factor, important primarily to low vision and motor disabled users, though bigger clickable areas also considerably increase a product's overall usability for able-bodied users as well.

Here, both the login button and the ease of access button (sic!) are small to say the least. Neither of them are an easy target for someone who has trouble precisely operating the mouse. Moreover, a visually impaired user might actually not notice the ease of access button considering its size and the poor color contrast!

The only large, easily clickable widgets on the screen are the avatars that represent different users.

Layout


Apart from the irrationally frugal use of button space the layout is a good one.

Not only does it strongly support the screen's primary use case (i.e. actually logging in to the system), it also places the controls for other relevant use cases in easily accessible places. Even a severely visually impaired user who can normally barely follow a pointer on the screen or motor disabled user having difficulties with precise hand movements, will probably be able to move the mouse to the bottom left corner to open the accessibility menu and turn on supportive features for their disability (assuming they see the button or otherwise know it's there).

Fonts


There's not much text on the login screen which doesn't yet mean there's no room for improvement as far as the font goes. The clear, sans serif font is a pretty good choice (it's been claimed that sans serif fonts are more readable than serifs). But that's not much of a merit when you outline your font with a shadow and put it on top of a barely contrasting background.

Nevertheless, I wouldn't blame the font for this screen's accessibility issues.

Keyboard access


The screen is keyboard accessible which means that both screen reader users and those who can't use a mouse can operate it.

After choosing a user, focus automatically moves to the text field so you can type your password straight ahead. After that all you need to do is hit the enter key to log in.

The keyboard focus animations, however, are barely visible to low vision users.

Comprehensibility


The big user avatars are a good hint that you should first choose a user for the login session.

The text field also clearly signals what is expected of you thanks to the "Password" ("Hasło" in my Polish system version) hint placed inside it.

The arrow button, however, could have been replaced with something more explicit (e.g. a classic "Log in" button) especially as it's so small and easy to miss.

One more non-standard icon used in this screen is the "ease of access" button. True, it may be known to Windows users, but won't necessarily ring a bell with those migrating from other platforms where a simple wheelchair icon is usually used to represent accessibility settings.

Conclusion?


What can I say... I often use this logon screen as a practice accessibility evaluation task for the participants of my accessibility trainings and they're always amazed at how poor this design is accessibility-wise.

Not to say it doesn't have it's merits - it could easily be turned into a fully accessible screen by applying just a few basic accessibility principles like providing adequate color contrast and element size.

Basic desktop accessibility features for low vision users

Having discussed the basics of web accessibility in a previous post, it's time to take a look at the accessibility features desktops have to offer.

Magnifiers


A screen magnifier is a piece of software used to, well, magnify all or part of the visible screen. Simple as the concept may be, it is often quite confusing for those not used to it.

A screen magnifier may take the form of a virtual lens you move around the screen using your mouse. But it may just as well be docked in a corner or at one edge of the screen giving the user a special "magnification zone" showing whatever the mouse is currently pointing at. Or you could have a full screen magnifier which magnifies the whole screen at once.

Naturally, the magnification level can be customized - sometimes you can set any value you like, but usually you have to choose amongst a few predefined options.
 
A magnifier can also provide additional features such as color options for the magnification window or focus and keyboard tracking.

There are various screen magnifiers available for different platforms, e.g. the Windows Magnifier application or Compiz for Linux.

Color themes


Color theme customization is the next most important accessibility feature for low-vision users.

Unfortunately there is no such thing as an optimal color theme for all users - or even all use cases.

It is typically assumed that high color contrast (such as putting white text on a black background or vice versa) is a good thing. This, however, does not necessarily need to be the case for all users.

When dealing with large bodies of text, many people will intentionally avoid high contrast, claiming it tiers their eyes.

Similarly, choosing between the dark foreground on light background or dark background with light foreground models is also tricky and depends solely on users' individual preferences.

Pointer settings


When using a pointing device (most commonly a mouse - even when you're considering a group of disabled users), most people probably won't ever think of configuring it. However, customizing pointer size, speed or sensitivity is a great option for disabled users (both low-vision and those with motor disabilities).

Also, enabling pointer trails (i.e. animated trails or shadows left by the mouse to indicate it's former position) are another useful option to help the user keep track of the mouse.

Keyboard shortcuts


Last but not least: keyboard shortcuts. They're probably the most underrated accessibility features ever.

Low-vision users are usually more comfortable using a keyboard than a mouse. This is because using the mouse requires you to constantly track the pointer's position on screen while a keyboard layout can be easily memorized and then used regardless of your visual capabilities.

A low-vision user will naturally drift towards keyboard shortcuts because they don't force him or her to constantly look for things on screen (the mouse pointer, a specific button etc.).

Basic web accessibility for low vision users


The range of visual impairment goes from "needs reading glasses for fine print" all the way to "blind from birth". Maintaining reasonable usability for this vast user group may seem a treacherous task (and to some extent it is indeed), but in this post I'll just focus on the sheer basics everyone needs to know.

Small text


The most obvious usability observation is that low vision users can't read small text. Duh! Depending on the degree of vision loss the user might be able to read the text by putting on glasses or moving closer to the screen or might not see it at all no matter how close up they get. When all else fails, a low vision user will do it the hard way and put a hand-held magnifier up to the screen to read the text - but believe me, you don't want to force make them do that! It works but it's uncomfortable, it's embarrassing and feels degrading. And totally not what you want to do when you're not alone in the room.

Unfortunately, big bulky fonts aren't widely acknowledged for their beauty or usability and clients somehow don't approve of larger font sizes, so designers tend to make default fonts pretty small. This in turn makes the site less accessible to low vision users.

Some web designers try to solve this problem by adding an enlarge text widget at the top of their page (or just beneath the heading of an article) to increase accessibility. It usually looks something like this:

AAA enlarge text button


You'd think that just about does the trick, but that's not the case. Of course, it's a nice little gesture of sympathy for some elderly or novice low vision users but many visually impaired don't ever click that button. Why? Here are a few potential reasons:
  • they don't notice it (seriously, it's happened to me),
  • they don't bother because they're used to hitting Ctrl + "+" (the typical browser shortcut for increasing the zoom level) or using some other system wide accessibility shortcut instead,
  • the maximum text size available through the widget is still too small.
The people who do use the triple "A" widget will probably be those with minor vision impairments. The really low vision users will have already found out about browser or operating system accessibility features.

Does this mean that the "enlarge text" button is a worthless addition to your web page? Not necessarily. There are people who will use it. But considering current web browsers' capabilities this feature definitely shouldn't be your top priority.

Fonts


Much more than font size, font face is something you should focus on - especially since it influences usability and user experience for all your users, not only the low vision ones.

If you value your website's usability, use a simple font. Fancy or handwriting style fonts are gorgeous to look at and at the same time a total readability disaster. They're not-so-easy to read for fully sighted users, let alone the visually impaired.

A simple font also makes a site more accessible to users with cognitive, learning or attention span disabilities.

Page layout


Now, here's something that should get your full attention.

Try this simple experiment: open up a couple of websites and view them at a browser zoom level of about 300%. Yes, 300%, it's not a typo.

What do you see?

Notice, that when you magnify a web page too much ("too much" basically meaning "more than the developer found plausible") you suddenly have to cope with lots of horizontal scrolling (and sometimes the page layout goes berserk or parts of the page disappear beyond the edge of the screen never to be seen again, but lets not worry about that for now).

Too much horizontal scrolling is a big usability "no-no" - it's time-consuming and amazingly irritating when you have to scroll back and forth to read every single line of text on the page. It's definitely something you don't want to force on your low vision user. Narrower columns of text definitely make life easier for those using magnification.

There isn't really a standard for optimal line length. If you set your browser zoom to 1000% (assuming the browser allows it) you'd have to put in a word a line and pray for no long words to appear. But that's not the point. Keeping your page looking reasonably usable at a magnification level of 200% or so is a good start.

Color schemes and color contrast


The last key accessibility component of a website is its color and graphics scheme.

One common misconception is that accessible websites are ugly. Yes, they can be ugly. But guess what, inaccessible websites can be ugly too.

For basic accessibility pretty much all you need to do is provide good contrast for the text on your page to make it easily readable.

I'll write a separate post on color contrast at some point, but for now assume that two colors provide good contrast if they are easily distinguishable when viewed in black and white. To get an idea of what "easily distinguishable" means: blue and yellow or white and blue are good but red and green or white and light gray are not.

color contrast examples

To make sure you've got a good contrast ratio, put the codes of your chosen text and background colors into a color contrast checker. You should aim for a contrast score of at least 4.5.

Also remember not to overdue it when it comes to patterned surfaces as they are another readability decreasing factor. If possible keep the text's background solid.

Summary


In short, the most basic rules for making a website low vision user friendly are:
  • Plan the layout of your page with magnification in mind.
  • Keep a good contrast ratio between the text and background.
  • Use simple, easy-to-read fonts.
  • Be careful when it comes to using patterns and textures.
  • Keep the default font a reasonable size - a text enlargement button is a nice addition, but users have many other ways to magnify the text.
More to come soon :)